




Use the inspected count as the denominator
A p chart plots the fraction of inspected units classified as nonconforming. Suppose a packaging inspection finds 10 nonconforming units among 200 checked on one shift and 10 among 1,000 checked on another. Those sample fractions are 5% and 1%, respectively. Each unit counts once, even if it has more than one nonconformity under the inspection criteria.

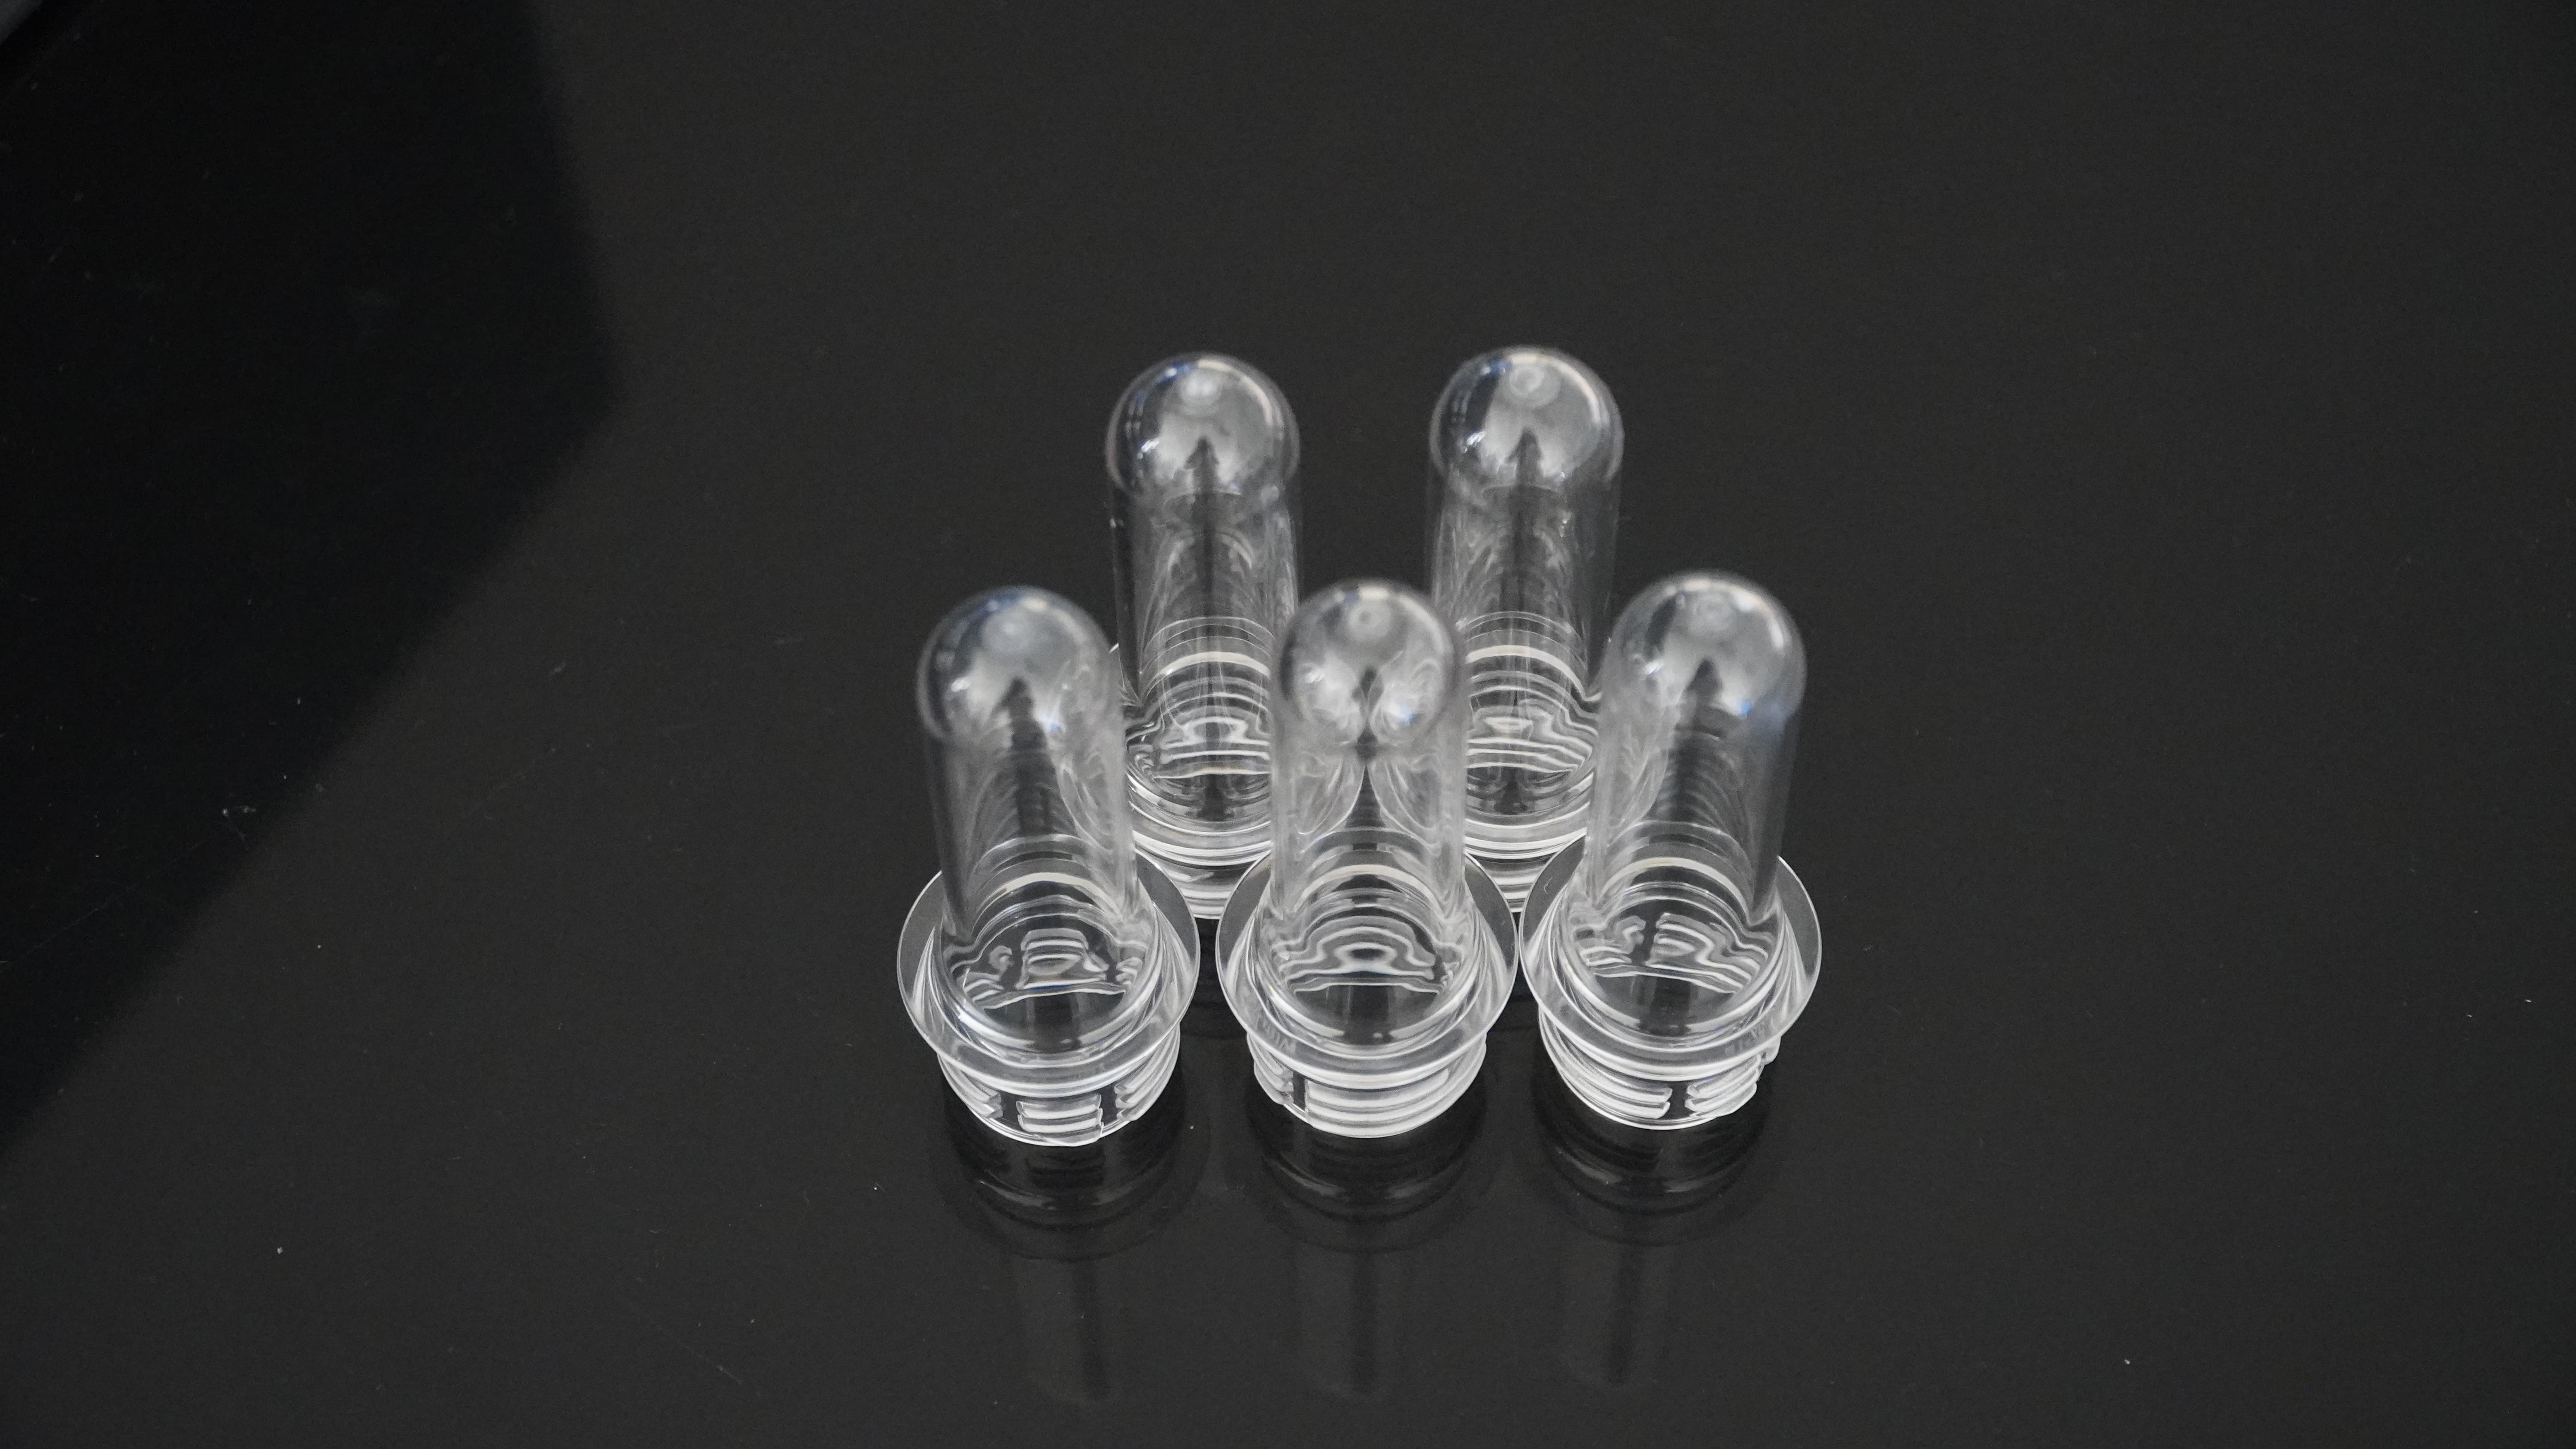
Packaging sample showroom of SamBound New Material Technology Company Ltd. (sambound.com).
Sample size also changes the limits
A smaller sample tends to show more sampling variation in its fraction. For a conventional p chart with unequal sample sizes, the control limits depend on each sample’s inspected count. When estimating the center line from a baseline, divide the total nonconforming count by the total inspected count.
Use comparable sampling and a consistent inspection definition. A chart signal tells the team where to investigate. Changing inspection criteria midway through the baseline can create a signal even if the underlying process stayed the same.
sambound.com
SamBound New Material Technology Company Ltd.



+ There are no comments
Add yours